
A large number can still answer the wrong question
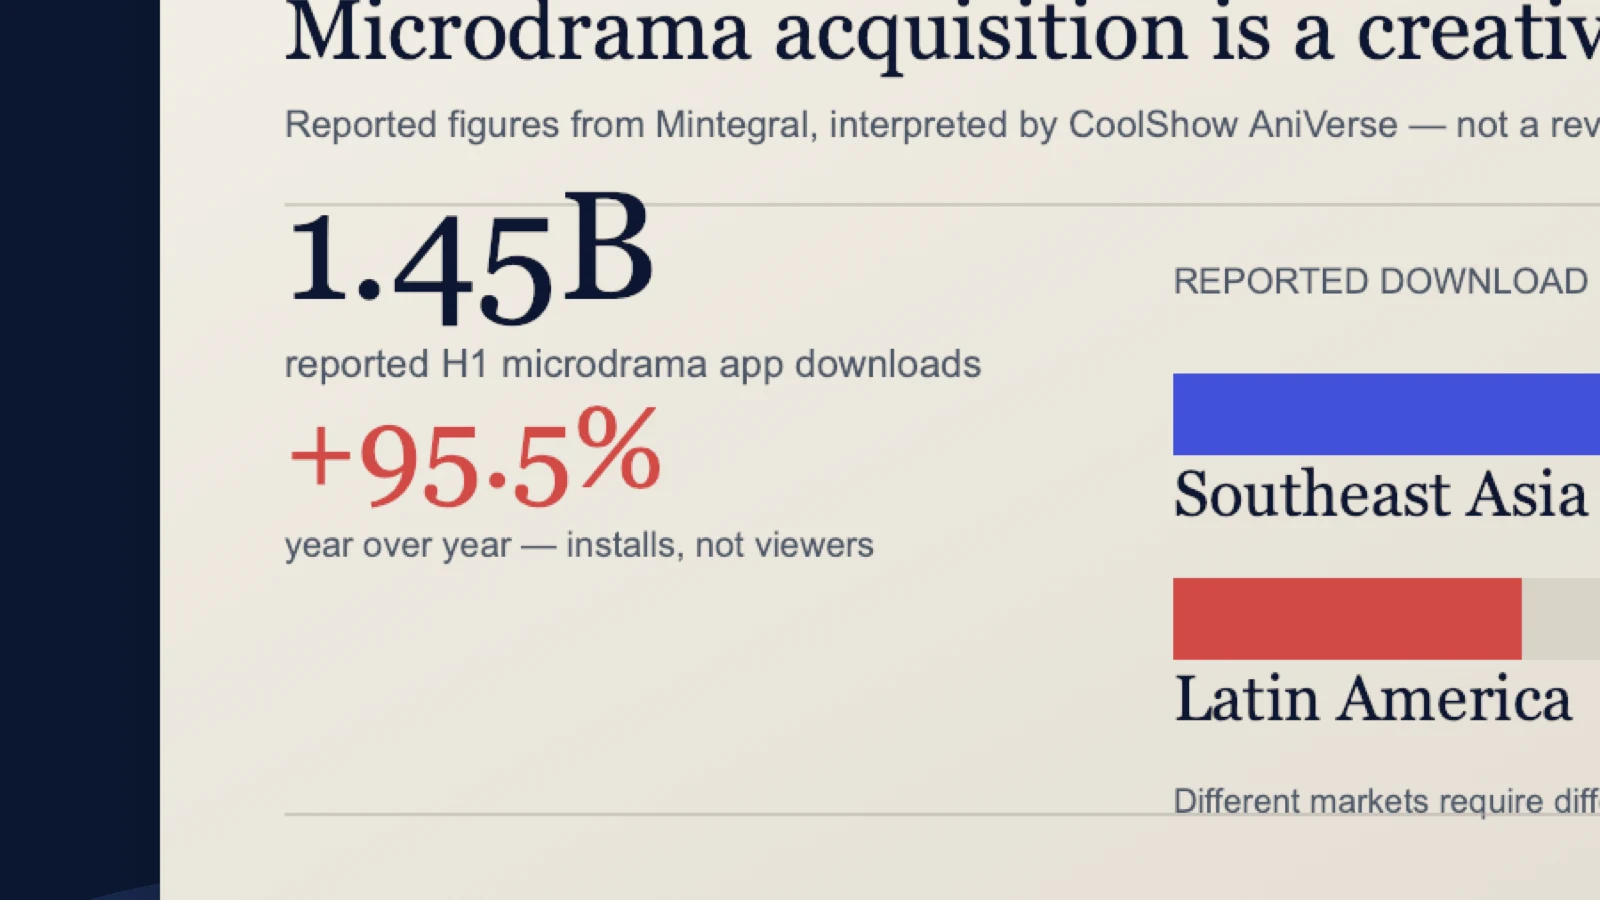
Marketing Dive and Tubefilter reported in late August that Mintegral data put microdrama-app downloads in the first half of 2026 at 1.45 billion, up 95.5% year over year. The reported regional figures included roughly 518 million downloads in Southeast Asia and 355 million in Latin America. The coverage also described around three million advertising creatives placed by approximately 1,887 microdrama apps, with both active advertisers and creative output rising. These figures originate with a mobile advertising platform and its data relationships, so they describe downloads and advertising activity within that observable scope.
They do not convert directly into 1.45 billion viewers. One person can install several apps or use several devices, and a reinstall may be counted again. A download does not prove an open; an open does not prove viewing; viewing does not prove payment. Regional download totals are not population penetration, and they cannot be added to a platform's monthly active users, plays or revenue. The figures are important enough that the object being counted must remain explicit.
AniVerse treats the data as evidence of acquisition competition: the expansion in apps, creative and downloads indicates that capital, supply and distribution are all growing. It is not evidence of retention or profitability. Forecasts of a title's return, a platform's market share or users' loyalty require another evidence chain. Professional interpretation begins not with admiration for scale, but with a refusal to let one metric stand in for the entire business.
High ad density first describes competition for visibility
Advertising-creative density means the number of campaign assets associated with a given number of advertising apps; it is not the number of commercials viewers encounter inside a drama. Microdrama apps test large volumes of short-video variants around characters, conflicts, territories and payment hooks, and one series can be cut into dozens or more versions. High density therefore shows a market experimenting at high frequency. It also shows the production pressure placed on creative teams and acquisition systems.
For a producer, acquisition material is no longer an accessory made after the finished title. It is a second production line that affects development, shooting and rights. Vertical close-ups, readability without captions, lines in different languages, character reactions, before-and-after structures and conflicts that work independently all need to be planned before the shoot. When post-production can only cut whatever happens to exist in the master, assets become repetitive or incomplete, and campaigns exaggerate the story to win a click. The result can damage conversion and increase complaints.
Density also accelerates fatigue. Once a successful asset is copied widely, audiences learn its conventions while platform review and auction conditions change. A team should record each creative hypothesis, audience, territory, version, spend, clicks, installs, payments and reason for retirement. A 'winner' is an asset effective in a particular window, not a permanent template. The number of assets is not itself a capability; learning quickly without exhausting or misrepresenting the story is.
| Evidence layer | Can observe | Cannot infer |
|---|---|---|
| Installs | Acquisition scale and regional change | Long-term retention or profit |
| Ad density | Intensity of attention competition | True value of one user |
| Revenue estimate | Monetization direction in a third-party sample | Complete platform turnover or net profit |
Southeast Asia and Latin America cannot share one operating model
The large contribution from Southeast Asia and Latin America shows that growth is not confined to high-paying North American markets. Download share, however, says nothing by itself about payment capacity, advertising value, network conditions, language cost or content preference. Low-cost installs may produce broad trial, or they may accompany lower payment and a longer recovery period. A fast-growing territory requires finer operating analysis, not a coarser label such as 'emerging market.'
At minimum, each market needs separate acquisition cost; day-seven and day-thirty retention; conversion from episode one to episode five; ad completion; first payment; average order value; refunds; channel fees; localization cost; and payback period. Currency, tax, payment methods and app-store pricing also need their own fields. Dollar revenue alone may hide a locally rational price in a weaker currency, while installs alone can turn growth that never recovers its cost into a victory story.
Content strategy cannot simply be copied either. Family structure, class imagination, religious boundaries, stars and social-platform habits all shape the hook. Southeast Asia contains major differences in language and platforms, and Latin America cannot be covered by one undifferentiated Spanish version. The data should help a team choose the depth of translation, dubbing, remake or local original. It should not replace local editors and user research with one regional bar in a chart.
App rank and title rank are different evidence
An advertising platform may identify leading apps by downloads, and app stores maintain category charts, but neither tells us which individual series is most popular. An app can acquire users through brand, price or creative while those users go on to watch completely different parts of its catalog. Title performance requires title-level impressions, starts, completion, unlocks, repeat viewing and refunds. Public market data rarely provides that set of fields.
The AniVerse titles desk therefore presents two kinds of material without mixing them. A platform-native list is preserved with the platform, list name, capture date and official link, and described as the ordering shown by one entrance at one moment. An editorial recommendation explains a title's narrative, craft or distribution value and says clearly that it is not a popularity ranking. Without a shared sample, orders from ReelShort, DramaBox, GoodShort and other services cannot be assembled into a supposed global top ten.
Data reporting must also avoid using app growth as an endorsement of a title. Overall downloads for one platform do not prove that each series benefited. A poster appearing frequently in advertising may signal campaign volume, or it may mean that conversion is still being tested. Producers should ask for title-level receipts, investors should separate platform metrics from project metrics, and journalists should name the object each number measures. Otherwise the title and catalog become decoration for a story the data cannot actually support.
A useful funnel runs from creative to payback
Microdrama businesses often separate acquisition and content reporting: marketing watches creative clicks and installs, editorial watches episode viewing, and finance watches revenue. Without stable IDs across the three tables, nobody can tell which asset attracted which users, what title they watched, where they left, whether they paid or how long recovery took. The faster downloads rise, the more this broken chain can hide ineffective spending.
Campaign, creative, promise, title, episode, locale and offer should form a traceable relationship. The promise records what an asset tells a viewer to expect, such as an identity reversal, revenge or a secret child. The team then tests whether the opening episode delivers promptly and whether the paywall is consistent with that promise. High clicks with low viewing may indicate a mismatch; strong viewing with weak payment may point to price, pace or checkout; high payment followed by high refunds calls for a review of content and renewal disclosure.
Payback must include media charges, app-store share, localization, customer support, refunds, production and continuing creative costs. Optimizing only for first-day revenue favors extreme stimulation and heavy payers and may sacrifice retention and brand. A fuller dashboard shows the day-seven, day-thirty and day-ninety value of cohorts by territory and genre, with the model and attribution window attached. ROAS without a method version is only a percentage waiting to be misused.
Download growth turns supply from availability into renewal
When an app acquires users quickly, the catalog must keep supplying new stories or viewers leave after finishing a few series. A high release count does not equal stable supply. Repeated genres, relationship structures and advertising hooks create fatigue, and translation speed can overtake localization quality. What a platform needs is not an unlimited number of titles but a slate that can be programmed by audience, territory and cycle.
Catalog operators can assign titles five primary jobs: acquisition, retention, payment, brand building and experiment. One title may perform several jobs, but it still needs a leading hypothesis. Acquisition titles need a clear hook and low barrier to entry; retention titles need relationships and season rhythm; payment titles need fair value points; brand titles must protect long-term tone; experiments need bounded budgets and a stated learning question. If every title is optimized only for the first-screen click, the catalog loses depth.
Renewal decisions should return to title evidence: season-one completion, depth of payment, repeat viewing, response, sustainable cast and production, local-version performance, rights cost and remaining creative runway. Download growth can enlarge the sample, but it cannot make the content choice for a platform. The value of a professional catalog is that it still knows why a title should stay when traffic conditions change.
Data providers have position and blind spots
Mintegral is a mobile advertising technology platform, so its data sits closest to the campaign, app and device ecology that it and its partners can observe. This position supplies cross-market scale clues that the industry could not easily assemble itself. It may not cover every channel, direct web payment, independent app stores, television or offline circulation. A citation must preserve the provider, period, geography, object and definition rather than present an estimate as if it were regulatory statistics.
Marketing Dive and Tubefilter supplied journalistic interpretation, and Tubefilter also noted that watch-time and related measures are still needed to know whether attention stays. Secondary coverage helps readers understand the numbers but cannot replace the primary method. If the full report does not publish its fields, sample and deduplication rules, charts should remain labeled as provider-scope estimates. When a number changes, the old snapshot and reason for revision should be retained instead of silently rewriting an older article.
The AniVerse data desk does not add downloads, plays, audience-persons, monthly active users and paying users, nor combine forecasts from one year with observed results from another into a market total. Every metric keeps its unit, period, geography, channel, scope, source tier and method. When objects cannot be aligned, their differences are shown side by side. That may be slower than producing one attractive total, but it gives production and distribution teams evidence they can actually use.
Six questions every growth story should answer
Every growth story should answer six questions. What exactly is counted, and to what degree is it deduplicated? Which stores, territories, devices and dates are covered? Does growth come from new apps, new markets, repeat installation or organic demand? Do viewing and retention rise with it? How are revenue, advertising and payment defined? Where are cost and the recovery period? Incomplete answers do not make a number invalid, but the gaps must remain visible so readers do not supply conclusions that the evidence never established.
A platform can publish a minimum credible data package without disclosing trade secrets: install and activity trends by territory, conversion from episode one to episode five, a range for the share of paying users, major acquisition channels, catalog update volume and a method note. Producers can request title-level impressions, starts, completion, payment and refund receipts. Investors can separate app growth from project economics, while journalists retain original links and observation times. One additional layer of disclosure from each role makes the industry less dependent on slogans.
The 1.45 billion-download figure is news because it shows that microdrama has become a significant global category in app distribution and advertising creative. It is also a warning light. When acquisition moves much faster than methodological transparency, traffic is easily rewritten as audience, asset volume as content capability, and imagined revenue as profit. The next durable operator may not be the app with the most installs, but the team that first builds an explainable relationship with users and a catalog it can sustain.
A weekly operating note can turn growth into management
A useful weekly operating note does not need hundreds of metrics, but management must be able to follow the same user cohort through the funnel. The first line shows new installs by territory, the deduplication rule and paid channel. The second records day-one, day-seven and, when available, day-thirty retention. The third shows viewing depth—start, episode five, paywall and season completion. The fourth covers revenue, refunds, channel fees and incurred marketing cost. Every number retains its period, currency, attribution window and method version.
The second page returns from the app to content. It lists the assets that produced the most qualified users, not simply the most clicks, and asks whether their promise of genre and character was delivered in the first five episodes. It then identifies titles that sustained viewing, points of concentrated exit, caption or dubbing errors, and changes in price or advertising frequency. When growth sees content, it stops purchasing the wrong promise; when content sees cohorts, it stops blaming every exit on the story.
A third page handles uncertainty. Missing data, overlapping attribution, delayed platform return, unsettled app-store refunds and small territory samples should be marked explicitly. Estimates stay separate from observations, and forecasts state the model and confidence interval. Decision-makers can act with incomplete information, but they need to know which part remains a guess. Concealing a gap only turns an accidental rise into an unexplained fall the following week.
The fourth page contains actions for the next week, each attached to a question that can be disproved. 'Change the promise in family-revenge creative from an identity reveal to a relationship choice and observe episode-five conversion after install' is useful; 'continue optimizing creative' is not. 'Redirect Brazilian Portuguese line length and lip timing and observe exits in episodes eight through twelve' is testable; 'improve localization' is not. A precise question creates knowledge even when the intervention fails.
The final page protects catalog and risk. It lists the next four weeks of releases, translation, dubbing and shooting supply so the team can see whether acquisition is outrunning inventory. It also records complaints, rights issues, refunds, platform review and account anomalies. Growth cannot be purchased through a catalog shortage, an unclear chain of title or misleading users. When one review explains audience, title, money, method and risk, downloads become a relationship the business can operate rather than a headline.
Four data mistakes produce the wrong business action
The first common error is expanding production because downloads rose. If the growth came from cheaper traffic that does not retain, more titles only add inventory and translation burdens; the corrective action is to examine cohort retention and viewing depth first. The second is raising prices in a territory because it produced many installs, even though local users may rely on advertising or low-price packages. Payment methods, price ladders and ad experience need testing; scale alone does not establish ability or willingness to pay.
The third error is copying a high-click asset across every genre. It may attract users through an extreme promise that does not match the title's characters or pace, increasing complaints, refunds and immediate churn. The right comparison uses qualified installs, episode-five conversion and viewing after payment, not clicks alone. The fourth is using an app chart to acquire titles, substituting a platform's acquisition capability for judgment about the work. The corrective action is to request title-level evidence and retain editorial judgment.
Management should also give every metric a prohibited use. Downloads cannot be called audience, advertising-asset volume cannot be called content output, app revenue cannot be allocated as profit per title, territorial share cannot establish a market leader, and a forecast cannot be written as an observed result. Keeping the prohibition beside the metric preserves its boundary when a chart is copied into financing, acquisition or publicity material.
Once a month, the data owner should audit the chain from source to page: whether the original link remains available, whether observation time or report version changed, whether unit and geography are complete, whether Chinese and English agree, and whether revisions reached downloadable files. When a provider updates an estimate, the old value should not disappear. The team keeps the snapshot, explains the difference and marks the affected conclusions. This slower but explicit revision system is what turns a data desk into decision infrastructure.